Understanding Mainframe Pricing to Aid in Modernization and Cost Control

Cost containment is an important criterion for IT departments as organizations everywhere embrace financial austerity. Every decision regarding your computer resources is weighed based on not only the value that it can deliver to your organization, but upon the cost to procure, implement, and maintain. And in most cases, if a positive return on investment cannot be calculated, the software will not be adopted, or the hardware will not be upgraded.
One area that many organizations are pursuing to reduce costs is mainframe application modernization. CloudFrame supports these efforts with its solutions for converting COBOL to Java. Such conversion can modernize the code and reduce costs by running the converted code on zIIP processors.
But how does that work? The total cost of mainframe computing can be high, and software is the biggest portion of that cost. The pricing model for most mainframe software remains based on the capacity of the machine on which the software runs. Note, however, that this pricing model will determine the actual cost, and it can vary dramatically from model to model. Our intent here is not to describe in detail how all the different IBM pricing models work. Although sub-capacity pricing models are the most commonly used, there is no widespread appreciation for how this actually works to lower costs other than a vague notion that the monthly costs are based on usage instead of capacity. And that is true, but the devil is in the details.
The most popular sub-capacity pricing models IBM mainframe shops use are variable workload license charging (VWLC) and advanced workload license charging (AWLC). There are nuances to each of these, but, for the most part, they function the same way at a high level. They are monthly license pricing metrics designed to match software cost more closely with its usage. Some of the benefits of these models include the ability to grow hardware capacity without necessarily increasing your software charges, pay for key software at LPAR-level granularity, experience a lower cost for incremental growth, and manage software cost by managing workload utilization.
So, how does it work? The first thing to understand is that most of IBM’s system software is categorized as monthly license charge (MLC) software. This means you pay for it monthly. Examples of MLC software include z/OS, Db2, IMS, CICS, MQSeries, COBOL, and others.
Basically, what happens with sub-capacity pricing metrics is that your MSU usage is tracked and reported by LPAR. You are charged based on the maximum rolling four-hour average (R4HA) MSU usage. MSU usage is continuously measured, and the R4HA is calculated. Every five minutes, a new measure of instantaneous MSU usage is taken, with the oldest measurement being discarded. Then a new average is calculated.
The R4HA is tracked continuously, for each LPAR, over the course of the month. Then the metrics are evaluated based on the products installed in the LPARs. You are charged by product based on the peak utilization of the LPARs where that product runs. All this information is collected and reported to IBM using the SCRT (Sub Capacity Reporting Tool). It uses the SMF 70-1 and SMF 89-1 / 89-2 records. So, you pay for what you use… sort of.
You actually pay based on LPAR usage, not product usage. Consider, for example, if you have IMS and CICS both in a single LPAR, but IMS is used only minimally, and CICS is used a lot. Since they are both in the same LPAR, you would be charged for the same amount of usage for both. But it is still better than being charged based on the usage of your entire central electronics complex (CEC), right?
Determining Where to Focus Your Cost Containment Efforts
The next step needs to be understanding how to focus your cost containment efforts using your knowledge of how IBM monthly software costs are charged. Over the course of the month, we have collected the R4HA for every LPAR every five minutes. The bill will be calculated using the peak R4HA utilization metric for the LPAR (or LPARs) for each MLC product you have licensed.
Assume that we have three LPARs: TEST, PRDA, and PRDB. Further, assume that we have z/OS in all three LPARs, Db2 in TEST and PRDB, and IMS in PRDA only. In this case, the cost for z/OS will be based on the combined peak for all three LPARs, the cost for Db2 for the peak of just TEST and PRDB, and the cost for IMS based on just the peak of PRDA. As the number of products and combinations of LPARs on which they run expands, the complexity of determining the impact of tuning and modernization for cost control increases.
Simplifying the Goal
Start by identifying the monthly R4HA utilization peaks. This information is provided in the monthly SCRT report that you deliver to IBM for billing. Typically, this report is produced by a systems programmer or capacity planner for delivery to IBM. The SCRT cross-references LPAR utilization and product execution by LPAR are used to determine the maximum concurrent LPAR rolling four-hour average utilization.
The P5 section of the SCRT report will show your products, the LPARs where they run, and the date/time of the peak for the month. For example, here is the P5 section of an example SCRT report: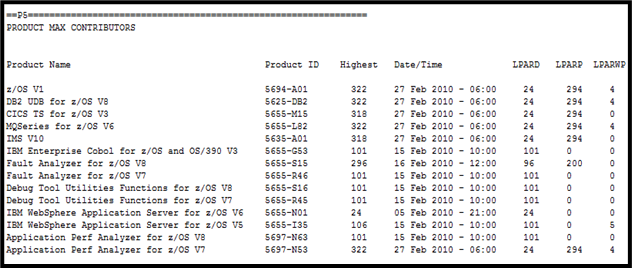
It bears repeating… MLC products are charged based on the peak R4HA utilization of the LPARs in which the sub-capacity products execute. The SCRT determines the required license capacity by examining, for each hour in the reporting period, first the four-hour rolling average utilization by LPAR and then which eligible products were active in each LPAR.
Each month you must run an SCRT report for IBM to determine your monthly billing. But you can also use it to pinpoint the specific peak workloads that contribute to your monthly MLC software bill. In the case of the report shown here, we see several peaks worth examining:
- The largest occurs on February 27 at 6 AM and represents the peak when a product runs in all three LPARs on the report.
- Another occurs on February 16 at 12 Noon for products that run in the first two LPARs.
- Other occur on February 15 at 10 AM and February 5 at 9 PM.
Using this information, you can focus on the workload that runs in these LPARs during these peak timeframes. Reducing the MSUs consumed during these peak times can reduce your monthly software bill, either by reducing the MSUs consumed and reported for the peak in question or by reducing the MSUs for the peak such that it is no longer the peak.
The Bottom Line
If you want to reduce software costs by reducing MSU usage, then it is important that you understand how charges are calculated. This article gives a high-level overview of the approach. In my next article, I will talk about the iterative nature of tackling mainframe software cost containment.
© 2022 Craig S. Mullins
Related Post

The Value of Incremental Modernization for COBOL Applications Portfolios
The concerns facing businesses regarding COBOL modernization are issues that have been…

What is the Average Cost per MIPS or MSU? Who…
The title of today’s post is a question that I get asked…
Removing COBOL to Cloud Obstacles Webinar Recording Available on YouTube
The recording of the Removing The Top 5 COBOL to Cloud Transformation…
Recent Comments